Getting started#
Installation#
Important
Python >=3.10 is required to run specvizitor. If you have an older version of Python installed in your system, you can use conda to create a virtual environment with Python version 3.10+ (if you are looking for a minimal conda installer, check out miniforge).
Install the latest version of specvizitor using pip:
pip install specvizitor
If you wish to install specvizitor from source, refer to the Installing from source section.
Basic usage#
Important
This tutorial shows how to inspect Grizli data products. Instructions on how to inspect other kinds of spectroscopic datasets in specvizitor can be found in the User Guide.
In this demo, we will be using data from the JWST Cycle 2 program “ALT”, reduced using the Grizli tool.
Download the data as a ZIP file from here (total size: 25.5 MB).
Unzip the archive and navigate to the directory to which the files have been extracted:
unzip specvizitor_demo.zip
cd specvizitor_demo
Start specvizitor:
specvizitor
Navigate to . Optionally give a name to the project (
demo.csvin this tutorial) and specify the path to the catalog - thecatalog.fitsfile in thespecvizitor_demodirectory: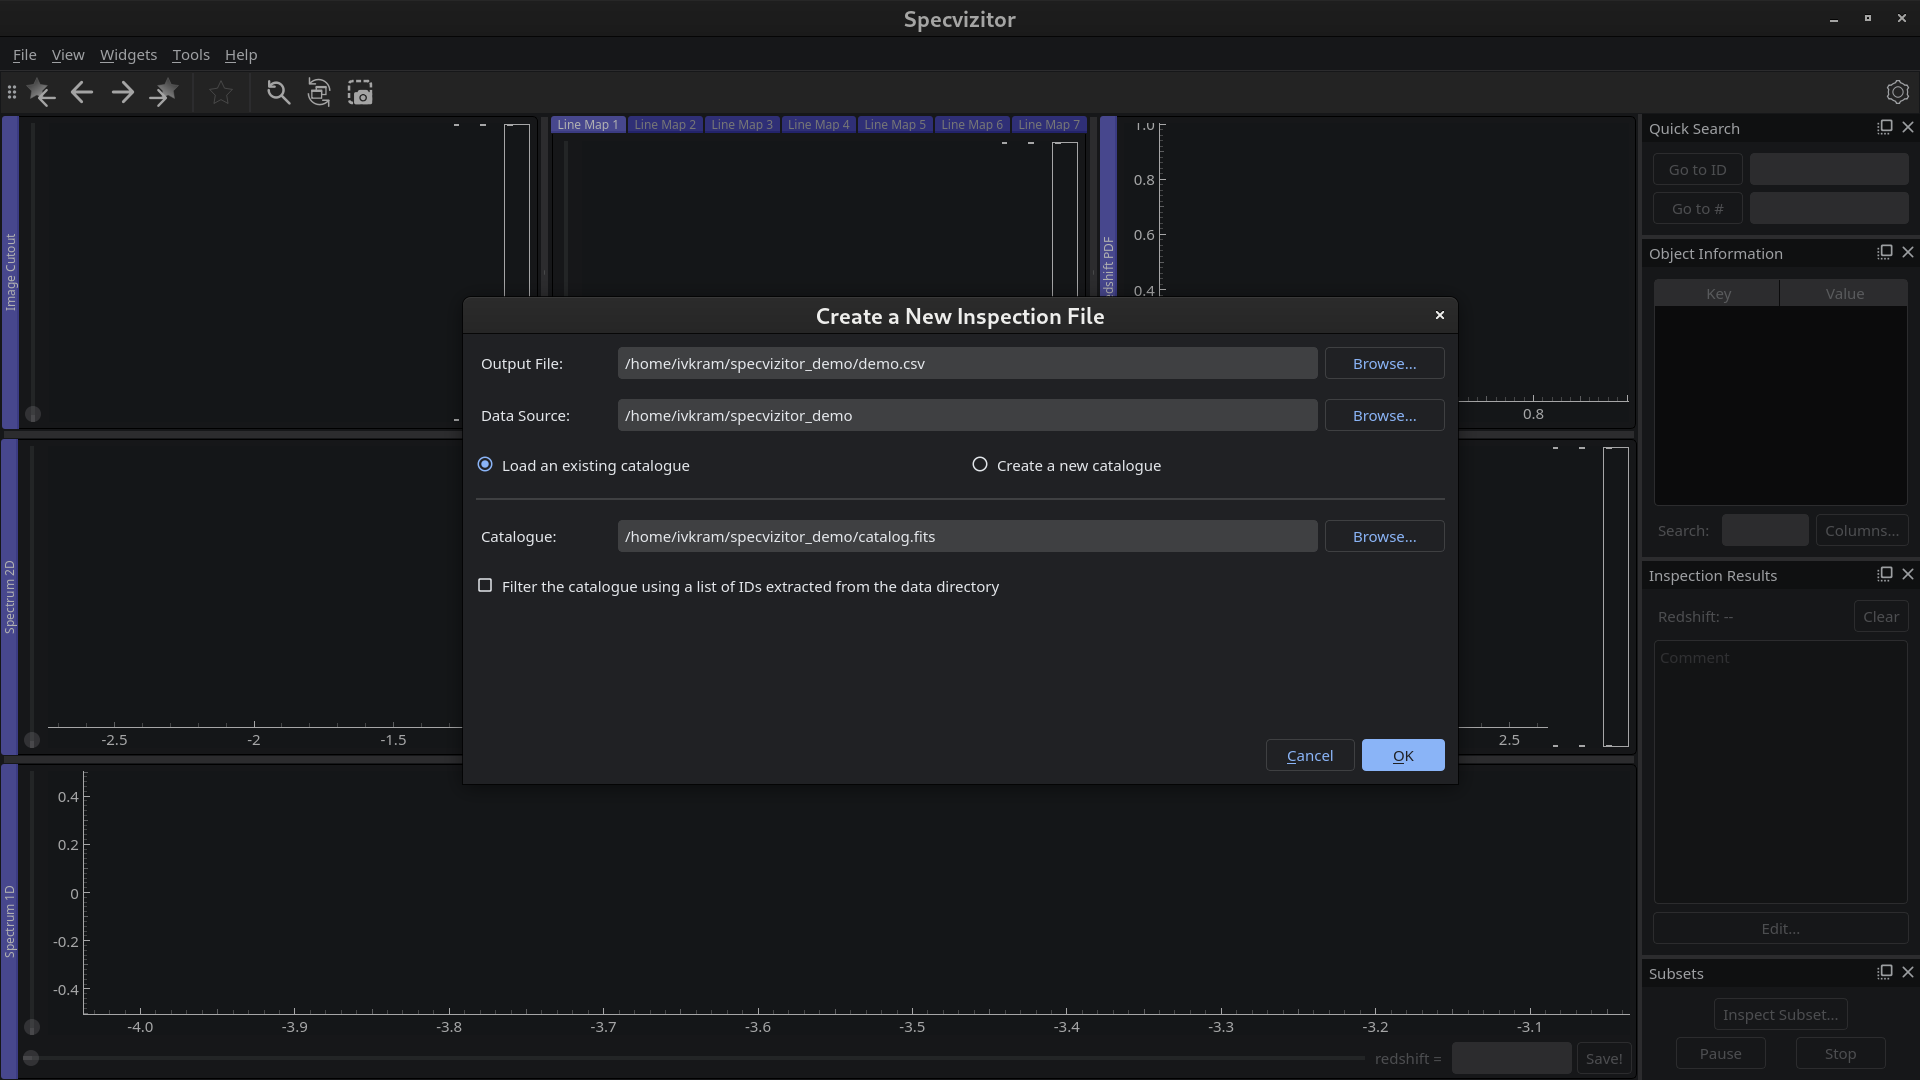
Click OK. You should now see the Grizli data products created for the first of the three galaxies included in this demo:
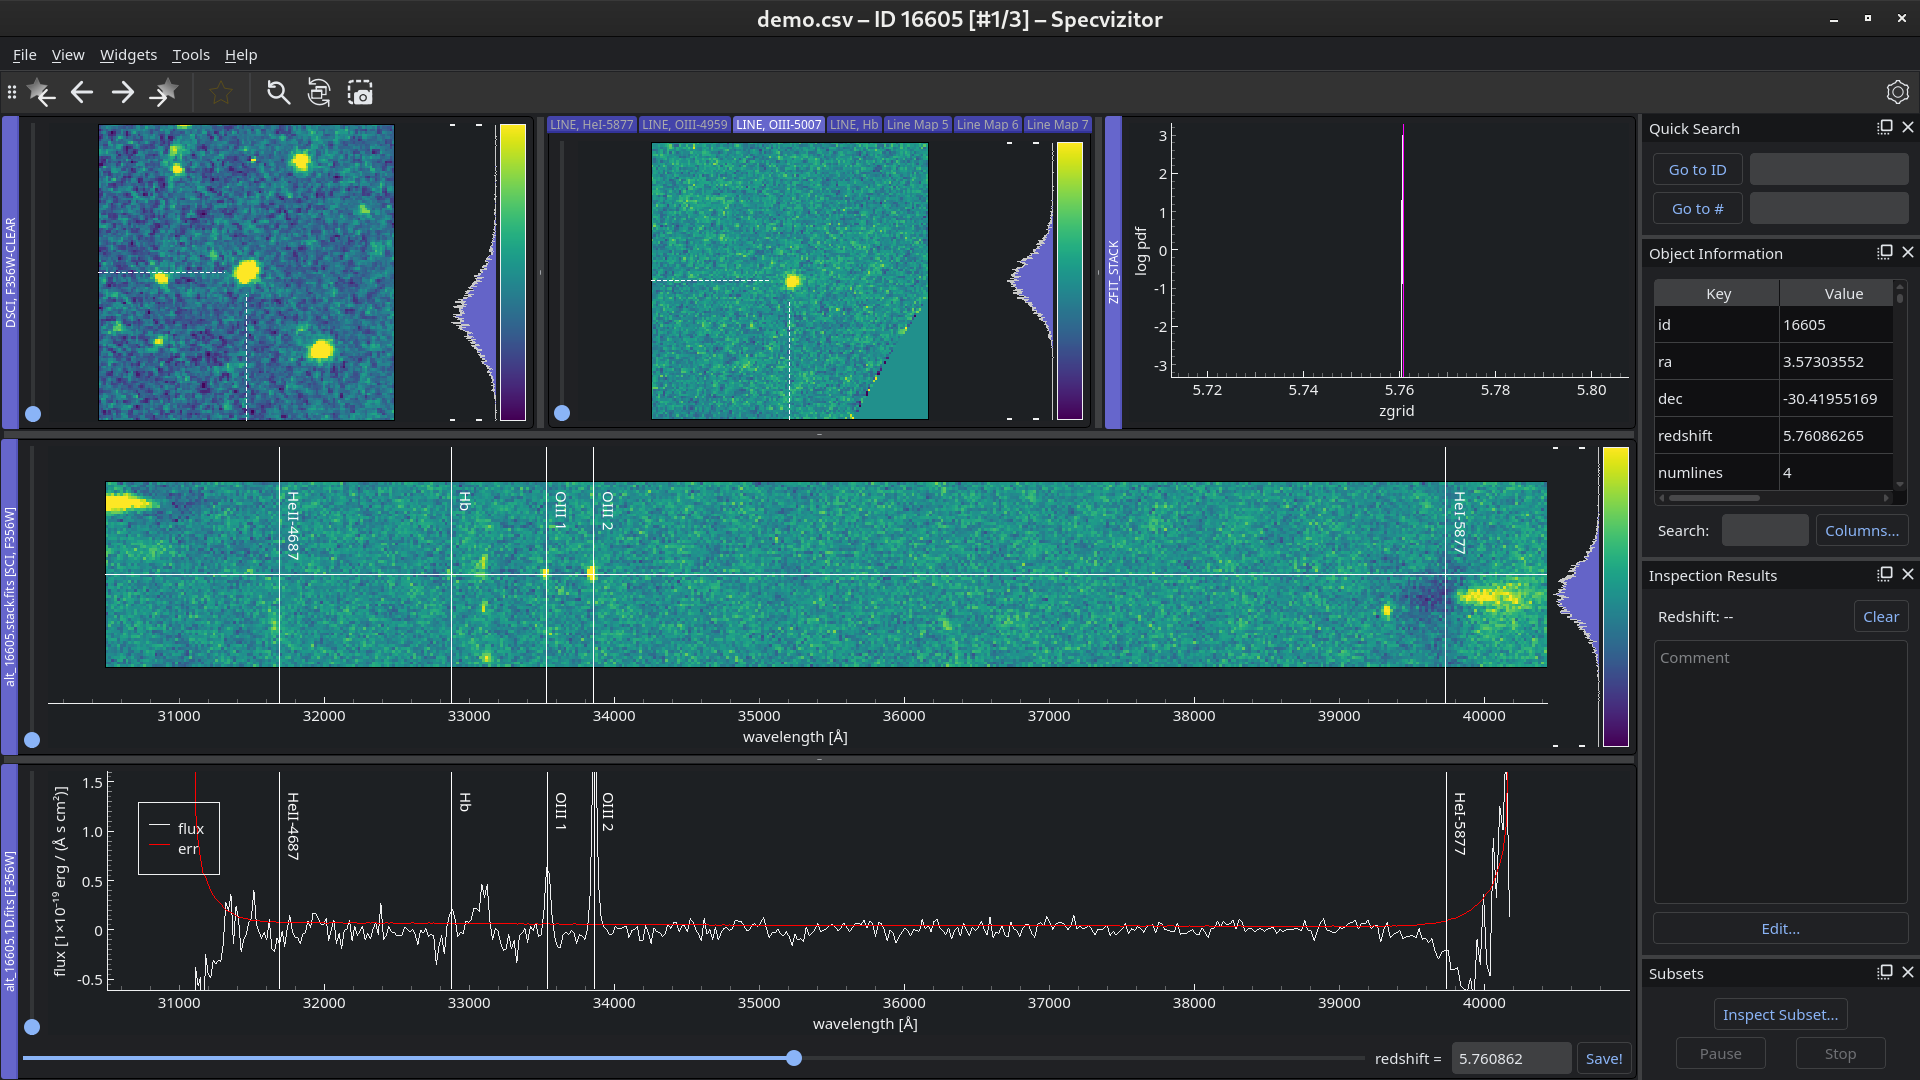
Here is the description of what is shown in the data viewer:
Top row, left to right: an image cutout in the F356W filter (i.e., the filter used in the NIRCam/grism observations), a series of emission line maps, and a redshift probability distribution function (z-PDF);
Middle row: a 2D grism spectrum;
Bottom row: a 1D grism spectrum.
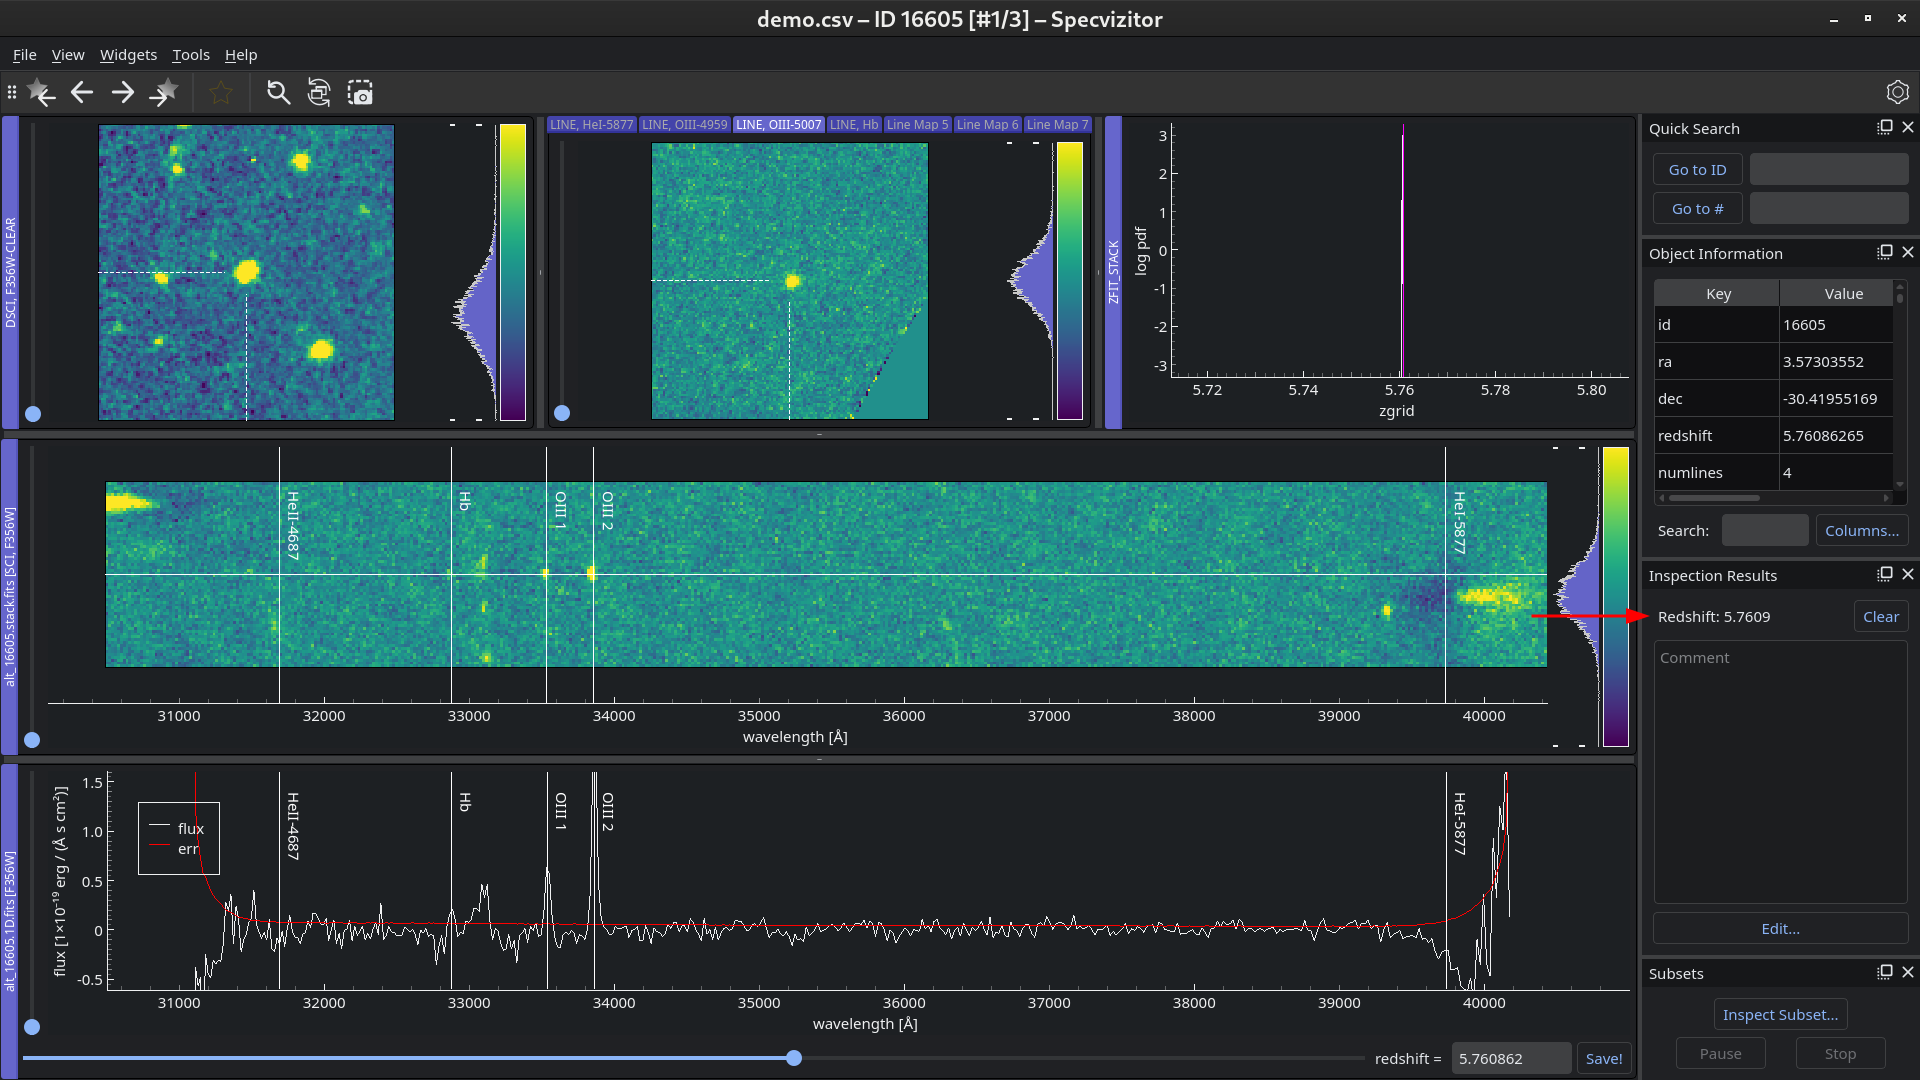
This galaxy was correctly identified by Grizli as an OIII-emitter at z ≈ 5.76 (you can see this on the right under Object Information). Save the redshift by pressing Ctrl+S or by clicking Save! next to the redshift slider. The saved value will appear in Inspection Results:
Go to the next object by pressing →:
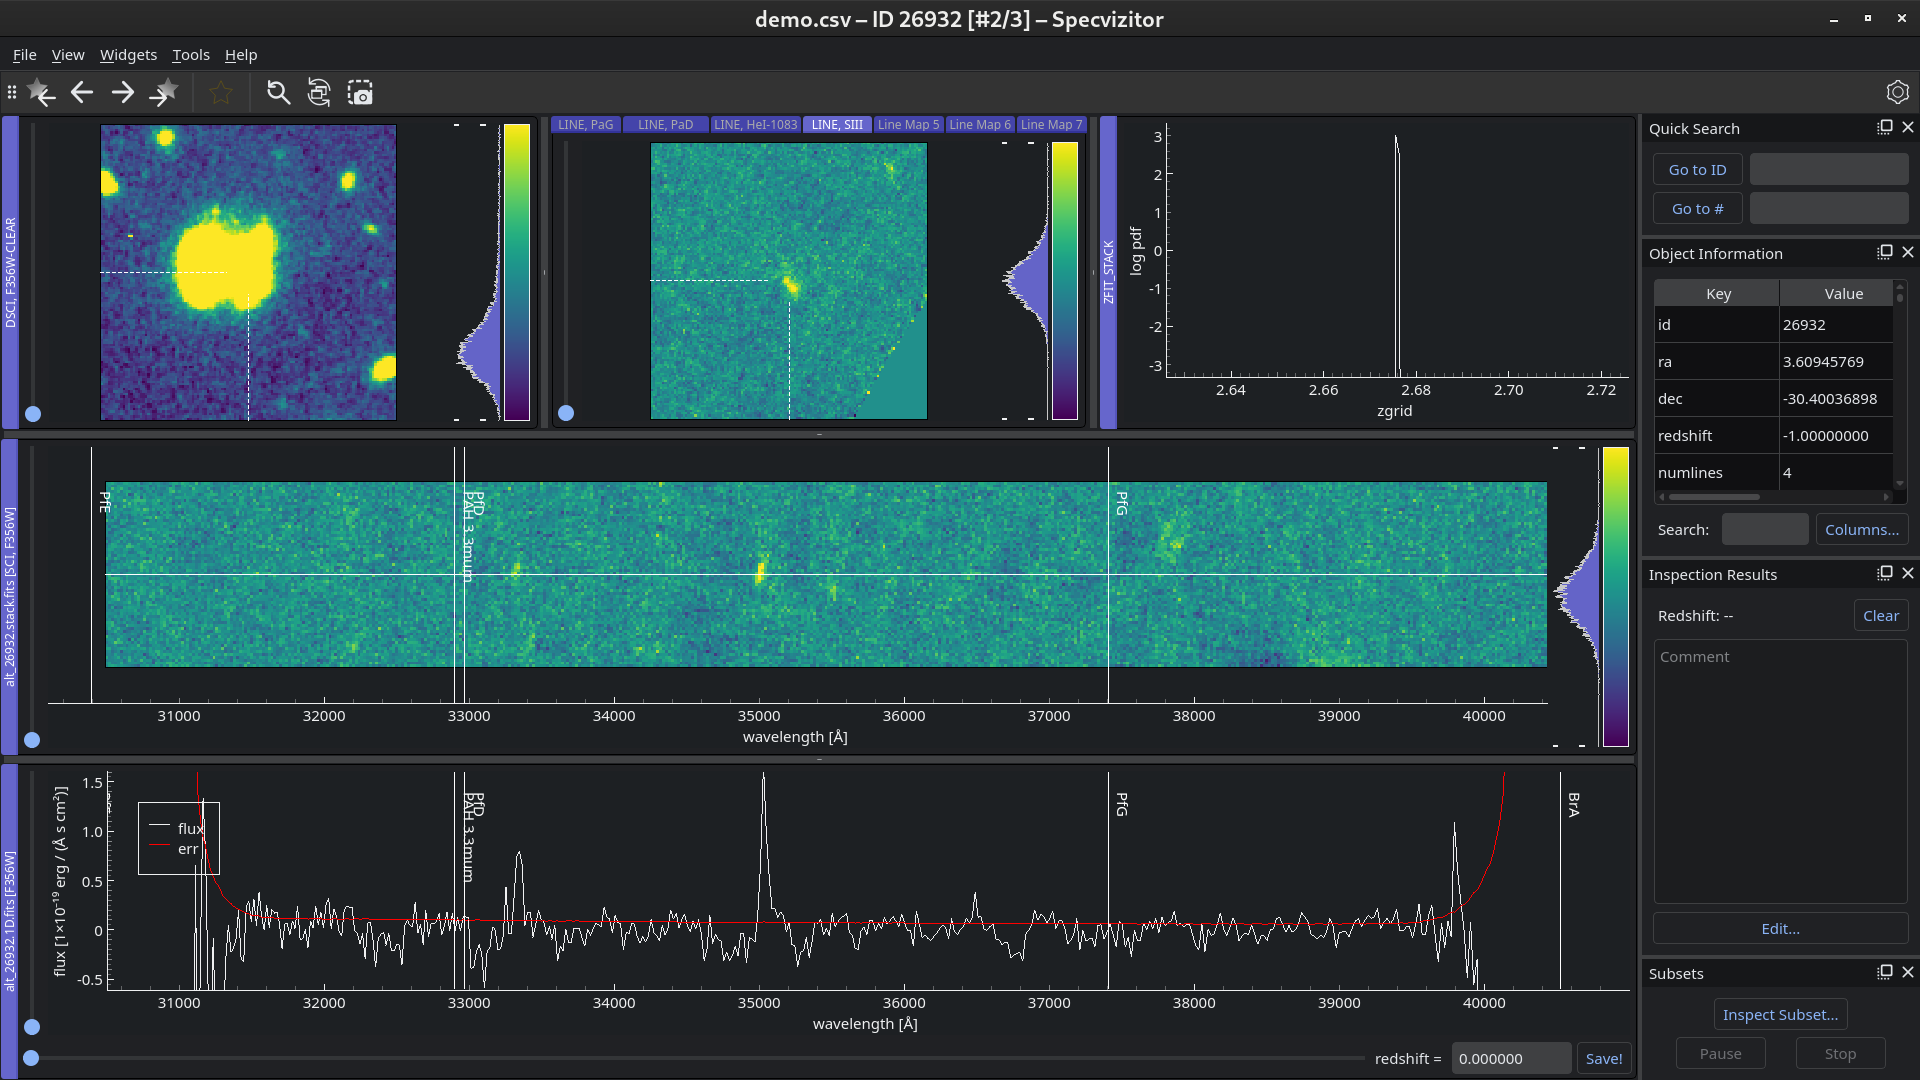
This object has an unphysical redshift value of
-1.0stored in the catalog, which means that spectrum fitting failed. Find the redshift that best describes the data by interacting with the slider at the bottom of the window: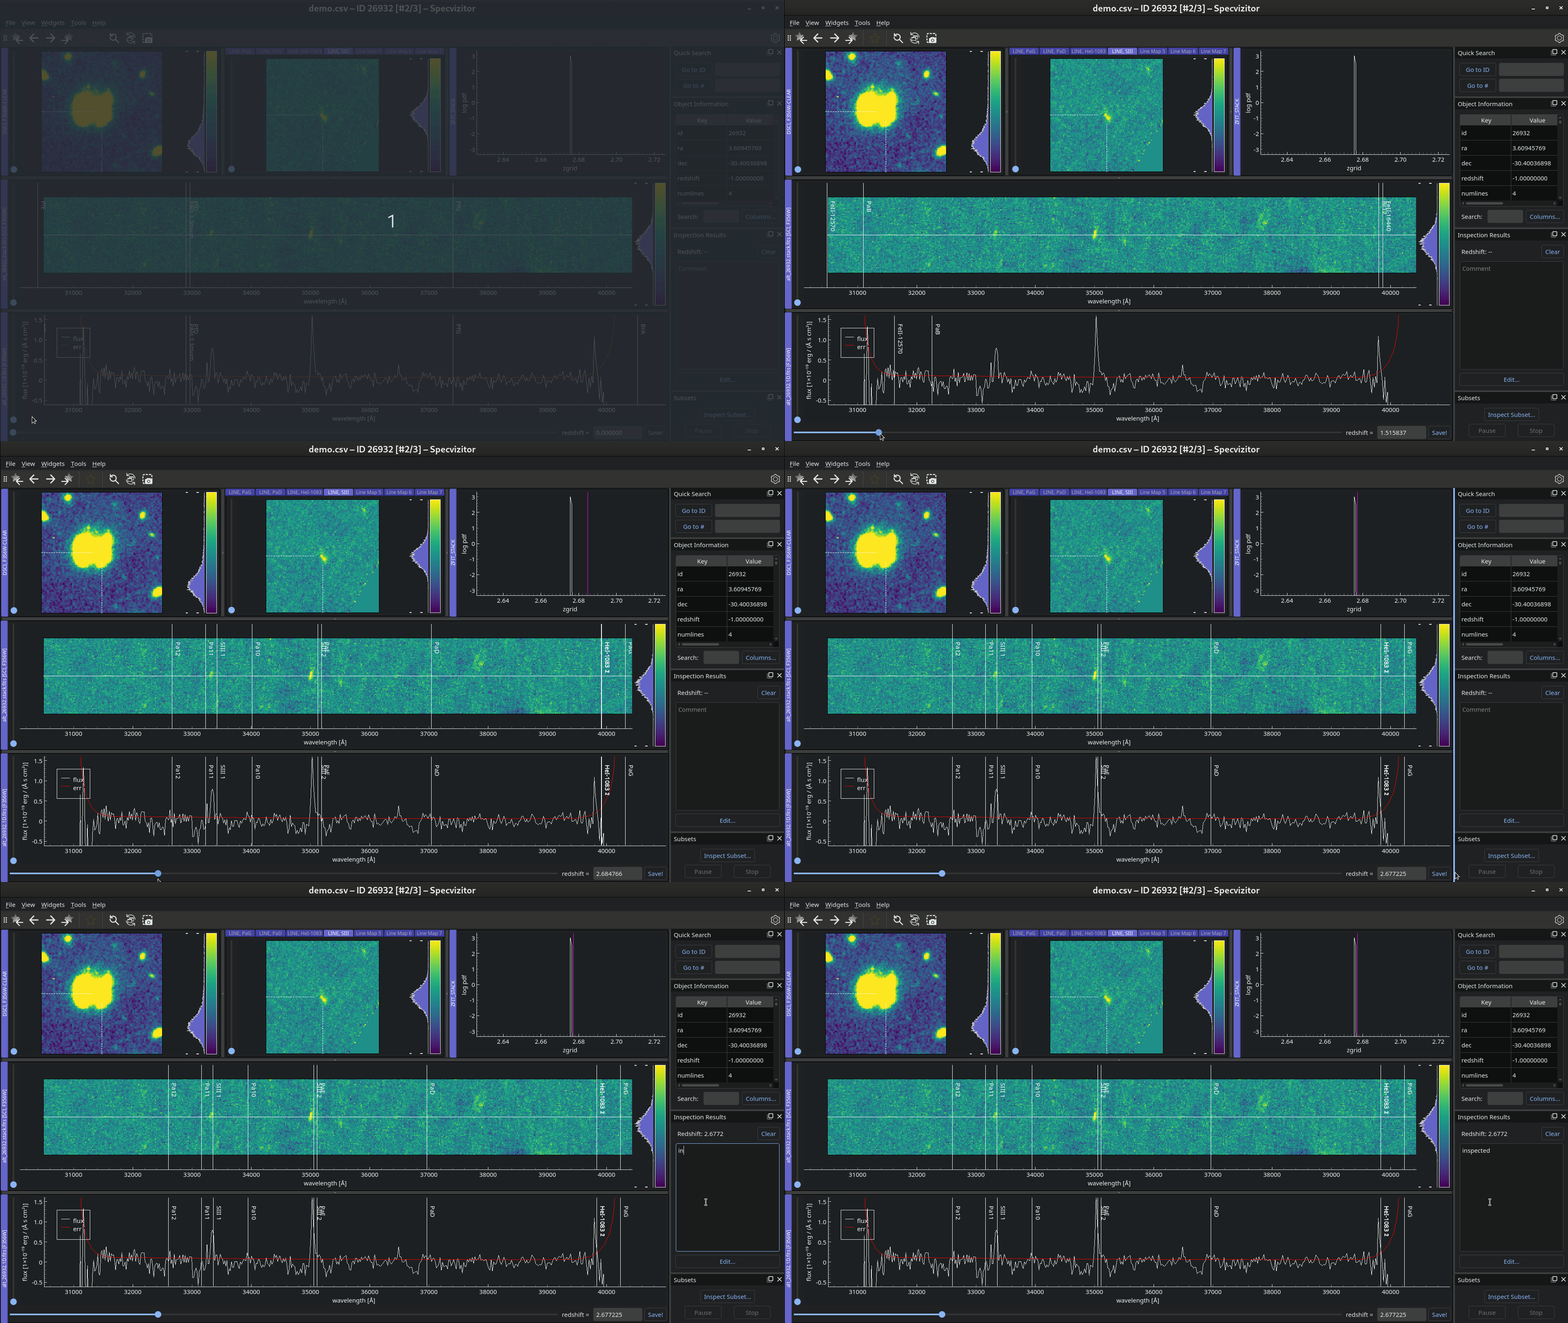
This galaxy is likely to be an SIII-emitter at z ≈ 2.68!
Save the redshift of the second object (see step 5).
Go to the last object by pressing → one more time:
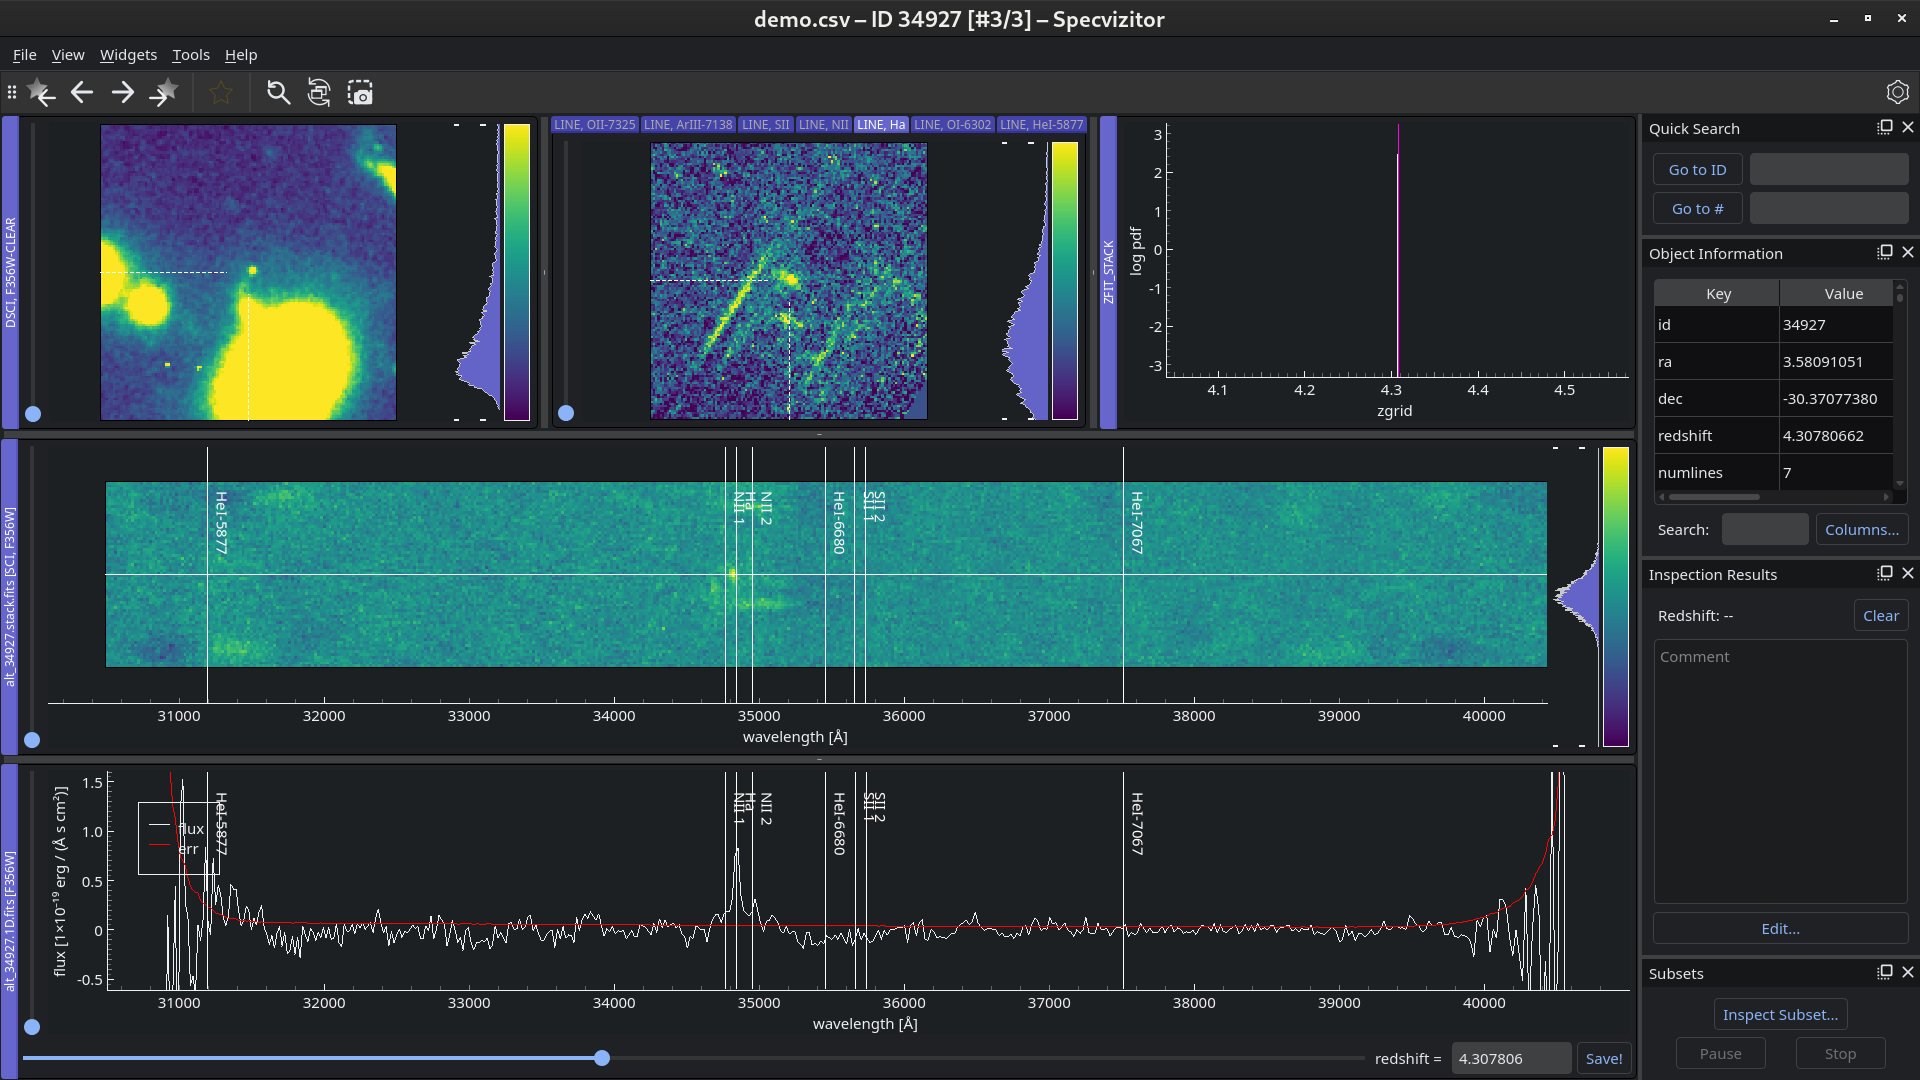
The 2D spectrum shows just one emission line which prevents us from unambiguously identifying the redshift of this object. However, we can see that Grizli suggests that this is an Halpha-emitter at z ≈ 4.31, which seems plausible considering the compactness of the source.
Save the redshift of the last object and close the window.
Finally, check the contents of the output file (also known as the inspection file):
demo.csv# id
starred
z_sviz
comment
16605
False
5.760862
26932
False
2.677225
34927
False
4.307806
As you can see, the redshifts were saved to the
z_svizcolumn.
Congratulations on completing this tutorial! If you want to learn more about specvizitor, navigate to the User Guide section.
Updating specvizitor#
To update specvizitor to the latest version, run the following command:
pip install specvizitor -U
Tip
If you see error messages after installing the update, try to run specvizitor with the --purge option: specvizitor --purge. Note that this action will erase application settings, including any custom widget configurations. If the issue still persists, refer to the Troubleshooting section.